
You can view a PDF of the report HERE.
On January 24, Truth in Accounting released its second Financial State of the Cities report, a comprehensive analysis of the fiscal health of the nation's most populous cities based on fiscal year 2016 comprehensive annual financial reports. This year, we have expanded our study to include the 75 most populated cities.
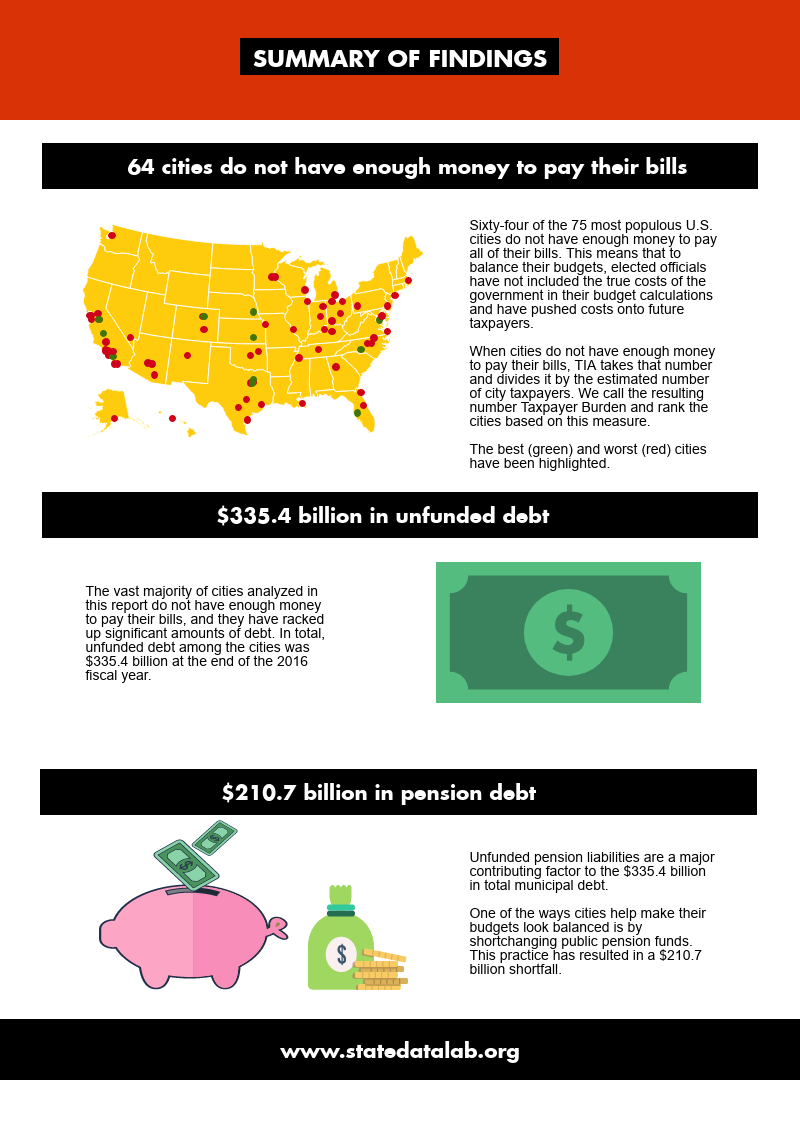
This year, the study found that 64 cities do not have enough money to pay all of their bills, and in total, the cities have racked up $335.4 billion in unfunded municipal debt. The study ranks the cities according to their Taxpayer Burden or Surplus™, which is each taxpayer's share of city bills after available assets have been tapped. Check out the data for your city at the State Data Lab.
75 city ranking (alphabetical)
Report findings
- Sunshine and Sinkhole Cities
- Top 5 Sunshine Cities
- Bottom 5 Sinkhole Cities
- 75 city ranking
- TIA grades the cities
- Does your city balance its budget?
- How timely is your city financial report?
- Retiree healthcare debt reporting rule will take effect in two years
- Why is truthful, transparent, and timely information important?
- Bring Full Accrual Calculations and Techniques (FACT) to budgeting

Government reports are lengthy, cumbersome, and sometimes misleading documents. At Truth in Accounting (TIA), we believe that taxpayers and citizens deserve easy-to-understand, truthful, and transparent financial information from their governments.
This is our second Financial State of the Cities (FSOC) report, a comprehensive analysis of the fiscal health of the nation's most populous cities based on fiscal year 2016 comprehensive annual financial reports. This year, we have expanded our study to include the 75 most populated cities.
At the end of the FY 2016, 64 cities did not have enough money to pay all of their bills. This means that to balance the budget, elected officials have not included the true costs of the government in their budget calculations and have pushed costs onto future taxpayers. TIA divides the amount of money needed to pay bills by the number of city taxpayers to come up with the Taxpayer Burdenä. If there is a surplus, that number is likewise divided by the number of taxpayers to come up with the Taxpayer Surplusä. We then rank the cities based on these measures.
We have also implemented a grading system for the cities to give greater context to each city’s Taxpayer Burden or Taxpayer Surplus. Based on our grading methodology, no cities received an A, 11 received B’s, 23 received C’s, 34 received D’s, and seven cities received an F.
However, TIA was unable to rank and grade two of the most populous cities—Newark and Jersey City in New Jersey—because they do not issue annual financial reports that follow generally accepted accounting principles, or GAAP. As a result, TIA included the next two most populated municipalities: Fort Wayne, Ind., and Irvine, Calif.
Cities in general do not have enough money to pay their bills. Based on our analysis, the total unfunded debt among the 75 most populous cities amounts to $335.4 billion. Most of this debt comes from unfunded retiree benefit promises, such as pension and retiree healthcare debt. This year, pension debt accounts for $210.7 billion, and other post-employment benefits—mainly retiree healthcare liabilities—totaled $119.5 billion.

Because government financial statements do not report all liabilities, elected officials and citizens are making financial decisions without knowing the true financial condition of their government. The lack of accuracy and transparency in government accounting prevents even an experienced user of government financial documents from understanding and evaluating a public-sector entity’s financial health.
TIA believes it is imperative to provide an honest accounting of each city's financial condition. Therefore, we developed a sophisticated model to analyze all the assets and liabilities of the nation's 75 most populous cities, including unreported liabilities. This is the second year TIA has released an annual FSOC study, documenting the truth about each city’s financial position.
Since all levels of government derive their just powers from the consent of the governed, government officials are responsible for reporting their actions and the results in ways that are truthful and comprehensible to the electorate. Providing accurate and timely information to citizens and the media is an essential part of government responsibility and accountability. The lack of transparency in financial information, city budgets, and financial reports makes it difficult for governments to meet this democratic responsibility.
This is the motivation and foundation for the nonpartisan mission of TIA: to educate and empower citizens with understandable, reliable, and transparent government financial information. TIA is a nonprofit, politically unaffiliated organization composed of business, community, and academic leaders interested in improving government financial reporting. TIA makes no policy recommendations beyond improvements to budgeting and accounting practices that will enhance the public’s understanding of government finances.

- Irvine, CA, pg. 28
- Stockton, CA, pg. 30
- Lincoln, NE, pg. 32
- Charlotte, NC, pg. 34
- Aurora, CO, pg. 36
- Plano, TX, pg. 38
- Arlington, TX, pg. 40
- Washington, DC, pg. 42
- Fresno, CA, pg. 44
- Tampa, FL, pg. 46
- Raleigh, NC, pg. 48
- Greensboro, NC, pg. 50
- Wichita, KS, pg. 52
- Louisville, KY, pg. 54
- Bakersfield, CA, pg. 56
- Tulsa, OK, pg. 58
- Corpus Christi, TX, pg. 60
- Las Vegas, NV, pg. 62
- Oklahoma City, OK, pg. 64
- Long Beach, CA, pg. 66
- Chula Vista, CA, pg. 68
- Anchorage, AK, pg. 70
- Henderson, NV, pg. 72
- Fort Wayne, IN, pg. 74
- Riverside, CA, pg. 76
- San Antonio, TX, pg. 78
- Colorado Springs, CO, pg. 80
- Santa Ana, CA, pg. 82
- Austin, TX, pg. 84
- Orlando, FL, pg. 86
- Indianapolis, IN, pg. 88
- Sacramento, CA, pg. 90
- El Paso, TX, pg. 92
- Albuquerque, NM, pg. 94
- Denver, CO, pg. 96
- Phoenix, AZ, pg. 98
- Anaheim, CA, pg. 100
- San Diego, CA, pg. 102
- Toledo, OH, pg. 104
- Columbus, OH, pg. 106
- Saint Paul, MN, pg. 108
- Cleveland, OH, pg. 110
- Virginia Beach, VA, pg. 112
- Lexington, KY, pg. 114
- Mesa, AZ, pg. 116
- Seattle, WA, pg. 118
- Los Angeles, CA, pg. 120
- Jacksonville, FL, pg. 122
- Omaha, NE, pg. 124
- Memphis, TN, pg. 126
- Minneapolis, MN, pg. 128
- Detroit, MI, pg. 130
- Milwaukee, WI, pg. 132
- Tucson, AZ, pg. 134
- Kansas City, MO, pg. 136
- San Jose, CA, pg. 138
- Baltimore, MD, pg. 140
- Atlanta, GA, pg. 142
- Houston, TX, pg. 144
- Boston, MA, pg. 146
- Miami, FL, pg. 148
- Fort Worth, TX, pg. 150
- Cincinnati, OH, pg. 152
- Nashville, TN, pg. 154
- Honolulu, HI, pg. 156
- St. Louis, MO, pg. 158
- Pittsburgh, PA, pg. 160
- New Orleans, LA, pg. 162
- Oakland, CA, pg. 164
- Portland, OR, pg. 166
- Dallas, TX, pg. 168
- San Francisco, CA, pg. 170
- Philadelphia, PA, pg. 172
- Chicago, IL, pg. 174
- New York City, NY, pg. 176

- Albuquerque, NM, pg. 94
- Anaheim, CA, pg. 100
- Anchorage, AK, pg. 70
- Arlington, TX, pg. 40
- Atlanta, GA, pg. 142
- Aurora, CO, pg. 36
- Austin, TX, pg. 84
- Bakersfield, CA, pg. 56
- Baltimore, MD, pg. 140
- Boston, MA, pg. 146
- Charlotte, NC, pg. 34
- Chicago, IL, pg. 174
- Chula Vista, CA, pg. 68
- Cincinnati, OH, pg. 152
- Cleveland, OH, pg. 110
- Colorado Springs, CO, pg. 80
- Columbus, OH, pg. 106
- Corpus Christi, TX, pg. 60
- Dallas, TX, pg. 168
- Denver, CO, pg. 96
- Detroit, MI, pg. 130
- El Paso, TX, pg. 92
- Fort Wayne, IN, pg. 74
- Fort Worth, TX, pg. 150
- Fresno, CA, pg. 44
- Greensboro, NC, pg. 50
- Henderson, NV, pg. 72
- Honolulu, HI, pg. 156
- Houston, TX, pg. 144
- Indianapolis, IN, pg. 88
- Irvine, CA, pg. 28
- Jacksonville, FL, pg. 122
- Kansas City, MO, pg. 136
- Las Vegas, NV, pg. 62
- Lexington, KY, pg. 114
- Lincoln, NE, pg. 32
- Long Beach, CA, pg. 66
- Los Angeles, CA, pg. 120
- Louisville, KY pg. 54
- Memphis, TN, pg. 126
- Mesa, AZ, pg. 116
- Miami, FL, pg. 148
- Milwaukee, WI, pg. 132
- Minneapolis, MN, pg. 128
- Nashville, TN, pg. 154
- New Orleans, LA, pg. 162
- New York City, NY, pg. 176
- Oakland, CA, pg. 164
- Oklahoma City, OK, pg. 64
- Omaha, NE, pg. 124
- Orlando, FL, pg. 86
- Philadelphia, PA, pg. 172
- Phoenix, AZ, pg. 98
- Pittsburgh, PA, pg. 160
- Plano, TX, pg. 38
- Portland, OR, pg. 166
- Raleigh, NC, pg. 48
- Riverside, CA, pg. 76
- Sacramento, CA, pg. 90
- Saint Paul, MN, pg. 108
- San Antonio, TX, pg. 78
- San Diego, CA, pg. 102
- San Francisco, CA, pg. 170
- San Jose, CA, pg. 138
- Santa Ana, CA, pg. 82
- Seattle, WA, pg. 118
- St. Louis, MO, pg. 158
- Stockton, CA, pg. 30
- Tampa, FL, pg. 46
- Toledo, OH, pg. 104
- Tucson, AZ, pg. 134
- Tulsa, OK, pg. 58
- Virginia Beach, VA, pg. 112
- Washington, DC, pg. 42
- Wichita, KS, pg. 52
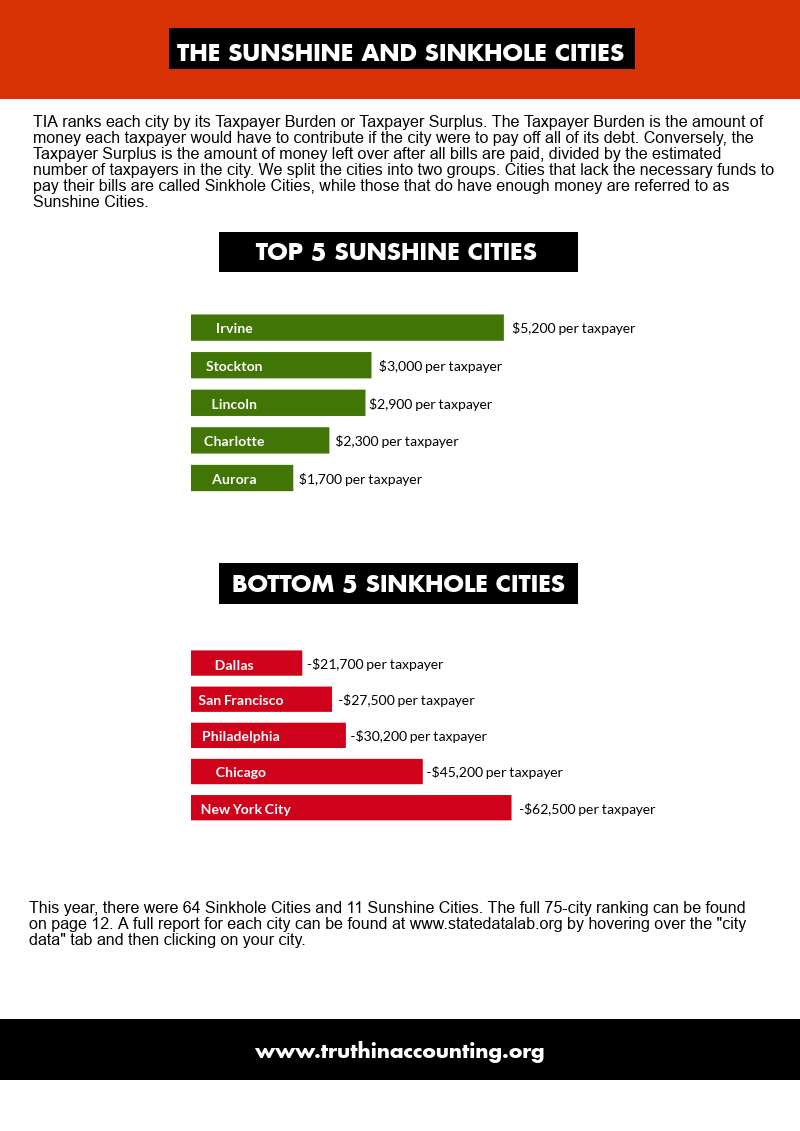

Irvine has a Taxpayer Surplus that stands at $5,200. There are very few U.S. cities that are free of bonded debt, and Irvine is one of them. The city now recognizes about $111 million in unfunded pension debt on its balance sheet and has enough assets outside of its pension system to pay for promised benefits.
Stockton finds itself in a much better fiscal position since a judge ruled the city was eligible for Chapter 9 bankruptcy protection in 2013. Stockton was facing a staggering debt burden, but creditors agreed to debt relief. Stockton now has more than enough assets to pay its bills, and the city’s overall economy is recovering.
Lincoln enjoys a Taxpayer Surplus of $2,900. Roughly one-quarter of the city’s $315.2 million in bills is related to unfunded pension and retiree healthcare benefits, but the city has more than enough assets to pay its bills. Responsible financial management caused unfunded employee benefit promises to amount to just a sliver of bonded debt, in contrast to many cities around the country.
Charlotte residents can thank their city officials for consistently not spending more than its incoming revenue over the last decade. The city’s 840,000 people face more than $700 million in unfunded pension and retiree healthcare obligations for city government employees. However, Charlotte’s discipline has helped it accumulate more than enough assets to pay the present value of its bills.
Aurora has an excellent track record of spending within its means. Expenses consistently have been running below grant, fee, and general revenue in the last 10 years—even during the years of the Great Recession.

Dallas has accumulated a significant debt burden for its residents and taxpayers, despite a relatively favorable economic environment in the state of Texas over the past 15 years. Our analysis shows nearly $8 billion in “money needed to pay bills,” or about $21,700 for every individual income taxpayer in the city.
San Francisco has one of the highest Taxpayer Burdens at $27,500, and it has massive unfunded obligations that are roughly equally divided among pension and retiree healthcare benefits.
Philadelphia remains one of the most financially troubled cities in the country. Looking across the 50 states, there is a tendency for cities in older states to have accumulated higher unfunded debts per taxpayer than cities in newer states, and Philly is no exception to the rule. At $30,200, Philadelphia’s Taxpayer Burden is driven by more than $10 billion in unfunded pension obligations.
Chicago has bequeathed its residents and taxpayers the second worst financial condition among the 75 most populous U.S. cities. While the city has improved its position with respect to retiree healthcare benefits, it still faces the problem of funding nearly $36 billion in unfunded pension obligations.
New York City ranks last because of its massive, growing debts. Despite elected officials’ long-standing claims of “balanced budgets,” the city has about $70 billion in unfunded pension benefits, and nearly $80 billion in retiree healthcare debt.
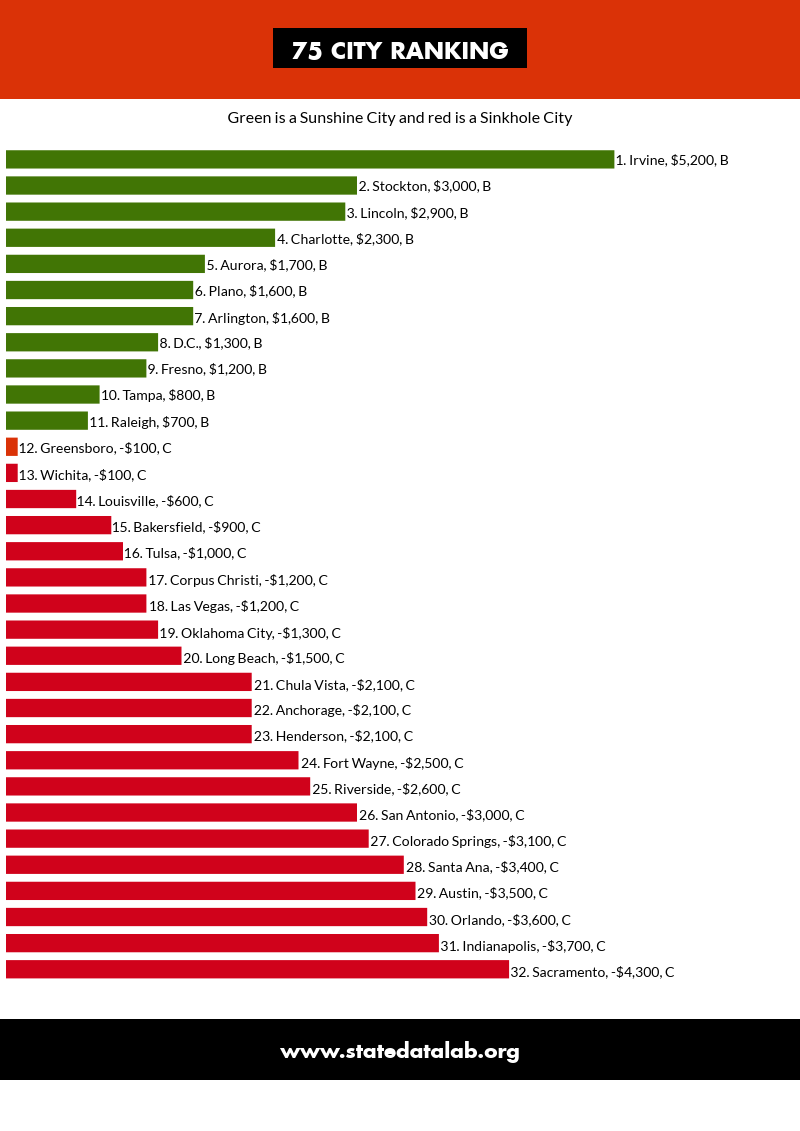
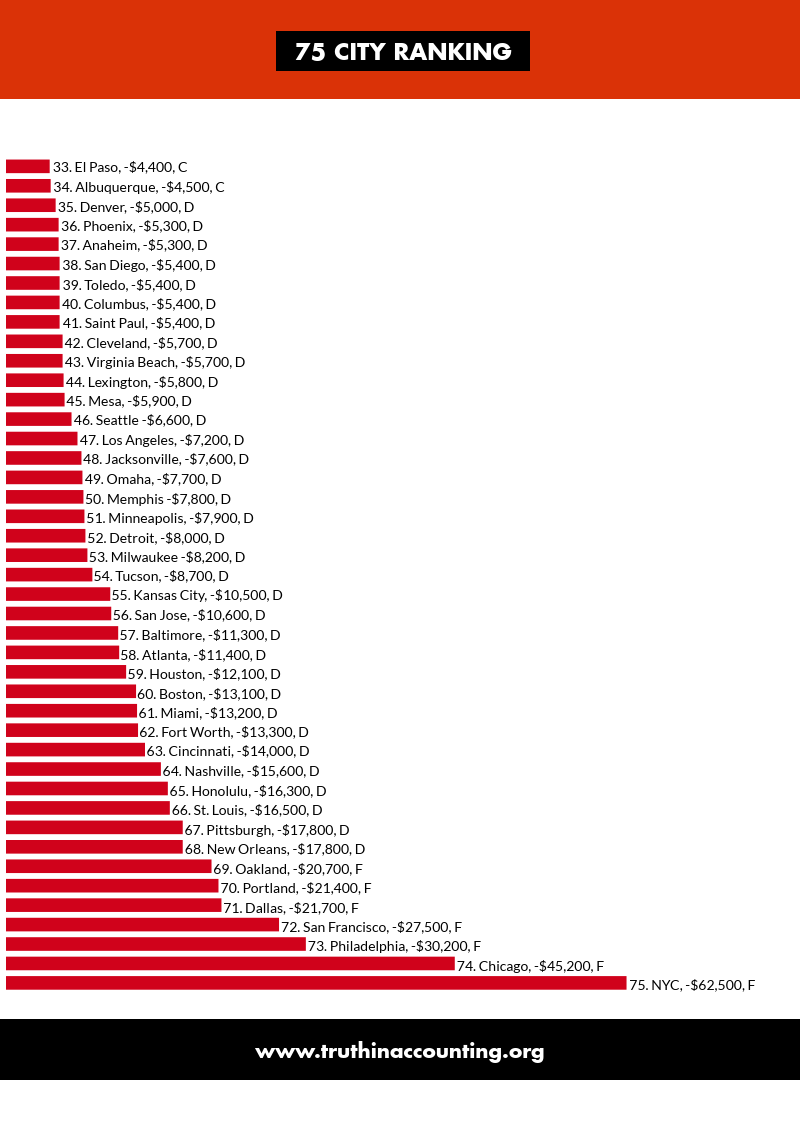

In our second FSOC, we have implemented a grading system for the cities to give greater meaning to each city’s Taxpayer Burden or Taxpayer Surplus. A government receives a C or passing grade if it comes close to meeting its balanced budget requirement, which is reflected by a small Taxpayer Burden. A and B grades are given to governments that have met their balanced budget requirements and have a Taxpayer Surplus. D and F grades apply to governments that have not balanced their budgets and have significant Taxpayer Burdens. Based on our grading system, here are the numbers of cities for each grade:
A grade: Taxpayer Surplus greater than $10,000 (0 cities).
B grade: Taxpayer Surplus between $100 and $10,000 (11 cities).
C grade: Taxpayer Burden between $0 and $4,900 (23 cities).
D grade: Taxpayer Burden between $5,000 and $20,000 (34 cities).
F grade: Taxpayer Burden greater than $20,000 (7 cities).


If a city has a balanced budget requirement, it makes sense that this would mean spending is equal to revenue brought in during a specific year. Unfortunately, in the world of government accounting, things are often not as they appear.
All of the 75 most populous U.S. cities have balanced budget requirements. Yet these cities have accumulated a combined $335.4 billion in debt. How can cities rack up debt and balance their budgets at the same time? It all depends on how you count.
Cities balance budgets using accounting tricks, such as the following:
- Inflating revenue assumptions
- Counting borrowed money as income
- Understating the true costs of government
- Delaying the payment of current bills until the start of the next fiscal year so they aren’t included in the calculations
The most common accounting trick cities use is hiding a large portion of employee compensation off the balance sheet and budget. Employee compensation packages include benefits such as healthcare, life insurance, and pensions. Cities become obligated to pay these benefits as employees earn them.
Although these retirement benefits will not be paid until the employees retire, they still represent current compensation costs because they were earned and incurred throughout the employees’ tenure. Furthermore, that money needs to be put into the pension fund in order to accumulate investment earnings. If cities didn’t offer pensions and other benefits, they would have to compensate their employees with higher salaries from which they would fund their own retirement.
Unfortunately, some elected officials have used portions of the money that is owed to pension funds to keep taxes low, and pay for politically popular programs. This is like charging earned benefits to a credit card without having the money to pay off the debt. Instead of funding promised benefits now, they have been charged to future taxpayers. Shifting the payment of employee benefits to future taxpayers allows the budget to appear balanced, while municipal debt is increasing.

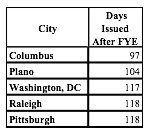
Timely information is crucial during government decision processes, such as creating a budget. However, most cities issue their comprehensive annual financial reports (CAFRs) late. The standard for cities to publish their CAFRs is 180 days after the end of the fiscal year. The national average for publishing these reports is roughly 174 days.
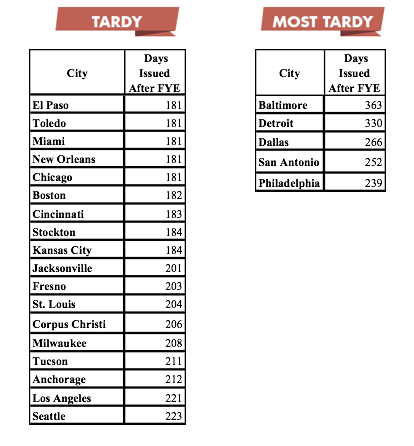
In 2016, four of the 75 most populous cities published their financial reports more than 250 days after the fiscal year end. The tardiest city was Baltimore, which took 363 days to release its CAFR. At 97 days, Columbus was the most timely in issuing its report.
Most corporate financial reports are issued within 45 days of their respective fiscal year ends. There are internal difficulties and obstacles for cities to reach this standard; however, timely financial information is critical so citizens and legislators can be knowledgeable participants in crucial decision-making processes, such as voting and budgeting.
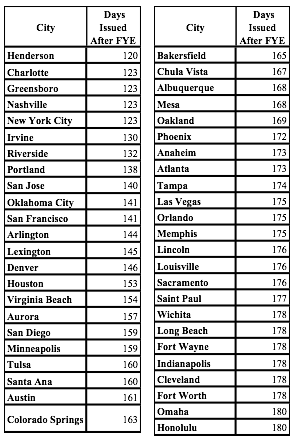
Cities that published their financial reports within the 180-day deadline are considered timely. This figure represents the number of days it took the city to publish its financial report after the end of the fiscal year. Here are the cities that reported their financials on time.


Here are the cities that did not publish their financial reports within the 180-day deadline.

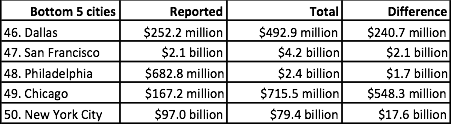
In fiscal year 2018, a new rule will be implemented that requires cities to report their retiree healthcare debt on their balance sheets. Our study found 21.3 percent of all promised retiree healthcare benefits—totaling $119.5 billion—was not reported on cities’ balance sheets in FY16.
The following chart shows the difference in reported vs. total unfunded retiree healthcare debt among the Bottom 5 Sinkhole Cities. As you can see, there is a significant difference between what cities currently owe and what they are actually reporting. With the impending change in the GASB reporting standard, cities’ reported retiree healthcare liabilities likely will balloon, and their reported net positions will dramatically decrease.

Democracy depends on an informed electorate, but due to current practices in both accounting and budgeting, the true financial health of a city can be obscured and citizens are deceived, or at best misled. Without access to truthful, timely, and transparent information, how can citizens be knowledgeable participants in their governments?
Accurate accounting requires all expenses to be reported in the city’s budget and financial statements when incurred, not when they are paid. Truthful budgetary accounting must incorporate all current compensation costs, including the portion of retiree benefits that employees earn every year.
A lack of transparency in government finance leads to the following problems:
- Accounting tricks allow elected officials to claim balanced budgets, giving residents a false sense of security, while cities sink further into debt.
- Residents do not know the true cost of their city government, and elected officials are able to spend amounts larger than the city’s revenues.
- Complex pension systems, which both citizens and elected officials have difficulty understanding, rack up massive debts, putting cities further in the red.
- Voters re-elect leaders based on false claims that budgets were balanced.
- Elected officials create and continue new programs and increased services without knowing the true cost of government spending.
- Our representative form of government is undermined because citizens become cynical and do not trust their governments.
Cities should use financial reports from the previous year to calculate a more accurate and realistic budget for the following year. However, because financial reports are not timely, they cannot be used to assist the budgeting process. Furthermore, these budgets do not include all costs—they exclude large portions of compensation costs because money is not set aside to cover retirement benefits as they are earned. Thanks to a new accounting standard, GASB 68, most of the pension debt is now being reported on the face of government balance sheets.
Some cities, however, continue to play number games with pension debt, using the previous year’s numbers even though current data is available. Cities also continue not to report the full cost of retiree healthcare debt in their budgets and balance sheets.
Cities’ efforts to climb out of their current financial holes must begin with honest government accounting and budgeting. Only then can we debate and develop responsible alternatives to place the cities on stable financial footing. As the saying goes, “If you can’t measure it, you can’t manage it.” How can cities begin to find solutions to crushing debt if they don’t know how much debt there is?

Budgeting based on Full Accrual Calculations and Techniques (FACT) requires governments to include expenses in their budgets when they are incurred, regardless of when they are paid. If a government promises pension benefits in the current period and must pay retirement claims in future periods, the liability and expense are recorded in the budget when the benefit is promised and earned. When the cash is actually paid, the liability is removed. This straightforward standard is a widely accepted private-sector norm.
FACT-based budgeting allows everyone to have complete knowledge of the financial health of their governments. FACT-based budgeting also provides information to future taxpayers about bills for services that they never have received or will receive.
FACT-based budgeting’s benefits include the following:
- Citizens learn the long-term effects of politicians’ current
- decisions.
- Politicians would have more difficulty hiding costs.
- Finances would be more transparent.
Through FACT-based budgeting, elected officials and citizens would have access to the true financial condition of their governments and be better equipped to make political and economic decisions both at the governmental level and in the voting booth.

Recommendations to citizens:
- To better understand your city’s finances, visit www.statedatalab.org and select your city to see your government’s true financial condition.
- Encourage your politicians to balance the budget truthfully.
- Promote accountability of your elected officials by demanding the use of FACT-based budgeting.
Recommendations to elected officials:
- Use FACT-based budgeting.
- Determine the true debt of the city, including all post-employment benefit programs.
- Stop claiming to balance the budget while putting off expenses into the future, placing a larger debt onto incoming generations.
- To gain a more accurate picture of your government’s financial condition, download your city’s FSOC on www.statedatalab.org.
- Encourage city financial information to be provided to taxpayers in a more timely fashion.
Recommendations to government financial report preparers:
- Release financial reports on time.
- Use the most recent pension data, not the previous year’s even if this requires a delay in issuing the government CAFR.
Recommendations to standard setters:
- Require governments to use the most recent pension data.

TIA researchers use a thorough and holistic approach to determine the condition of government finances. This approach compares bills—including those related to retirement systems, and excluding debt related to capital assets such as land, buildings, and infrastructure—to government assets available to pay these bills. We exclude capital assets because these should not be sold to pay bills.
Historically, state and local governments were not required to record the present value of their obligations for public employee retirement benefits, including pensions and retiree healthcare, as liabilities on their balance sheet. TIA digs into the underlying reports for hundreds of pension and related plans to find these liabilities, and then puts that information on our own version of what constitutes a valid balance sheet.
TIA ranks each city by its Taxpayer Burden or Taxpayer Surplus. The Taxpayer Burden is the amount each taxpayer would have to pay to leave the city free of excessive debt. We calculate this number by subtracting “total bills” from “assets available to pay bills,” and then take the resulting number, or “money needed to pay bills,” and divide it by the estimated number of taxpayers with a positive federal income tax liability. Conversely, a Taxpayer Surplus is each taxpayer’s share of the city’s assets after all bills have been paid.
This year we have added letter grades to our analysis of state and local governments’ financial conditions. These letter grades provide a summary measure supplementing the bottom-line dollar amount reported in our Taxpayer Burden calculation. Our letter grades also provide a valuable alternative to the widely reported letter grades issued by credit rating agencies. We believe government officials and the media have become too reliant on credit ratings. These ratings focus on the needs of bondholders and reflect a government’s ability to pay bonds with little consideration of other sources of government debt, such as unfunded pension liabilities.
It should also be noted that our rankings are based on reporting entities. City/state legal and financial relationships differ across the 50 states. For example, some cities include school systems in their consolidated results, others do not.

Truth in Accounting’s second annual Financial State of the Cities report found 64 of the 75 most populous U.S. cities do not have enough money available to pay all of their bills. The total amount of combined municipal unfunded debt of cities analyzed in this report stands at a staggering $335.4 billion. Of that, unfunded pension liabilities account for $210.7 billion and retiree healthcare debt another $119.5 billion.
While none of the 75 most populous cities received an A grade, 11 cities earned a B for their Taxpayer Surplus. The remaining cities had a Taxpayer Burden and varied along the grading system, with 23 cities earning C’s, 34 earning D’s and seven earning an F grade. TIA was unable to rank and grade two of the most populous cities—Newark and Jersey City in New Jersey—because they do not issue annual financial reports that follow generally accepted accounting principles, or GAAP. As a result, TIA included the next two most populated municipalities: Fort Wayne, Ind., and Irvine, Calif.
You can find more information about each city analyzed in this report by visiting www.statedatalab.org and clicking on the “city data” tab at the top of the page.