
We have updated our “Data-Z” website with data from the annual Financial Report of the U.S. Government. You can create charts at our website using a wide variety of financial, economic, and demographic indicators for cities, states and the federal government.
You can do that by:
Going to www.data-z.org.
Hovering over the “CHARTS” option at the top of the front page.
Choosing Federal, State, or City chart options, and then selecting available variables and the years you are interested in.
For example, let’s create three charts using the data we just updated.
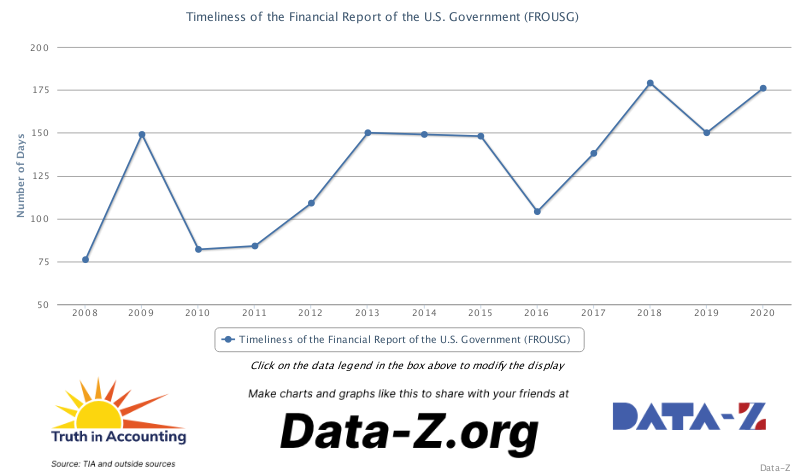
First, let’s see how long it takes to get the federal government’s annual report every year. It keeps taking longer and longer.
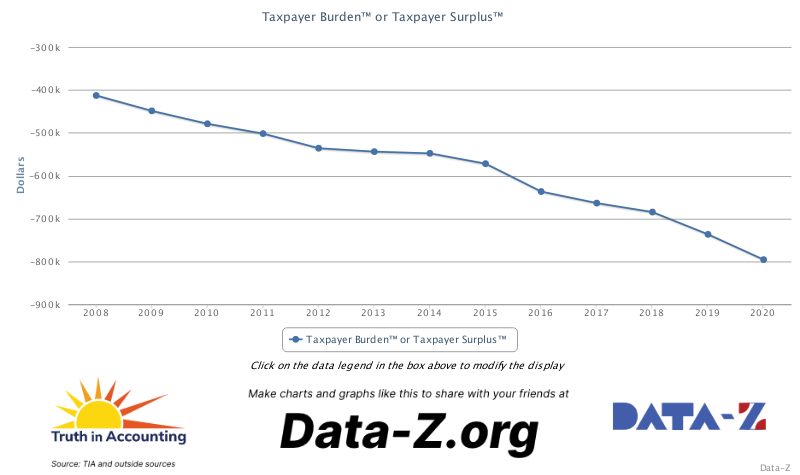
Second, let’s see what’s happened to the net financial position of the federal government over time, as reflected in our “Taxpayer Burden” measure of government finances. It keeps getting worse and worse.
Third, let’s look at an interesting variable we track while analyzing the rhetoric in the report. This is simply the number of times the word “unsustainable” appears in the report. The trend for that indicator has been going up and up.
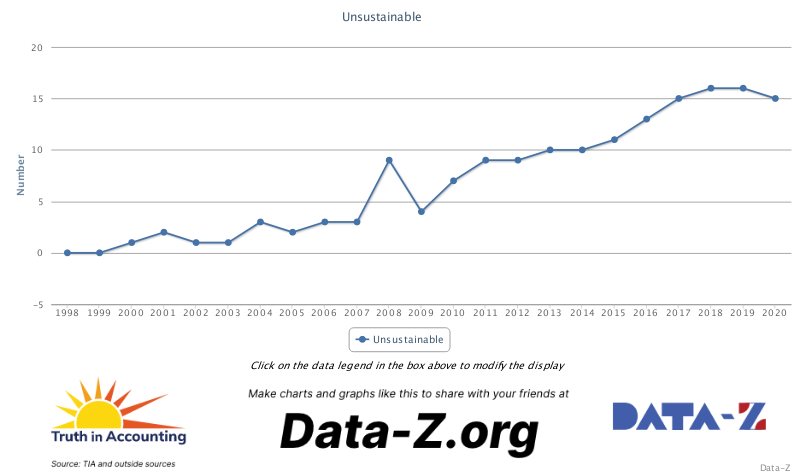
The number of “unsustainable” references did go down (by one) last year, even as the federal government’s fiscal deterioration accelerated in fiscal (September) 2020. And the report was written amidst massive spending initiatives undertaken after the end of the last fiscal year.
Not to leap to conclusions, but this could be one of those ‘dogs that didn’t bark’ stories. It may be less fashionable to call the federal government’s finances unsustainable these days, at least in some quarters.