By Eric Piatek
The just released IRS data on interstate migration of income offers interesting insights into current migration patterns in the United States. The most recent data available to the public is for 2020. Despite being a pandemic year, 2020 followed trends seen in 2019 and years prior; states with large Taxpayer BurdensTM (as is shown below) continued to suffer mass out-migration of taxable income, while states viewed as tax havens have seen a large influx of income from other states. According to Truth in Accounting a Taxpayer Burden represents each taxpayer’s share of their state’s debt.
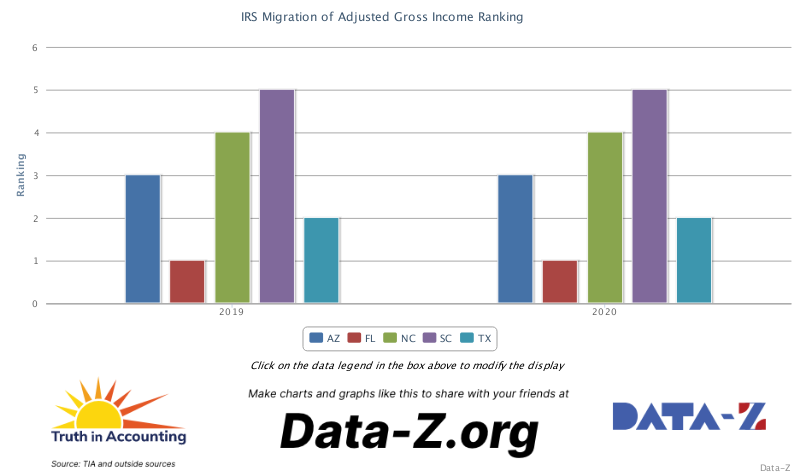
The top five performers in net Adjusted Gross Income (AGI), calculated by taking inflow AGI minus outflow AGI, are Florida, Texas, Arizona, and North and South Carolina. These same five topped the charts in 2019–in the same order, no less. So, why have these states been performing so well in the past few years? To understand this, we must first understand who is migrating to these states.
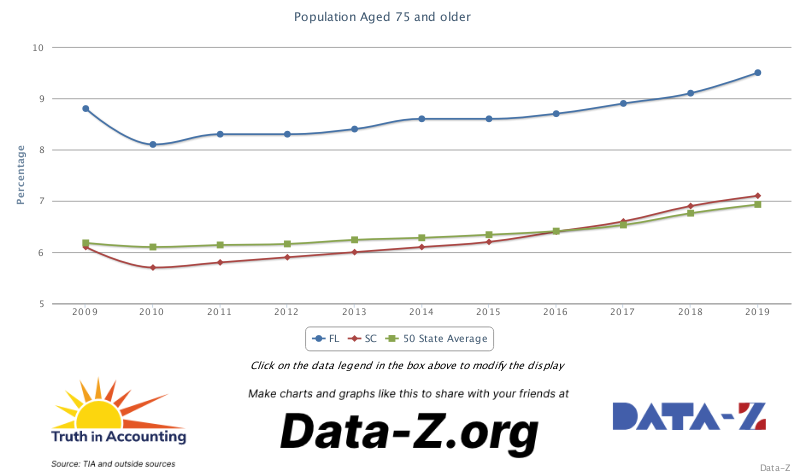
In the case of Florida and South Carolina, the elderly population continues to grow in these states, providing both with a steady increase in taxable income. Florida, between 2019 and 2020, had a net gain in individual tax returns of over 81,000! Those aged 55 and older accounted for 57.1 percent of this increase with over 46,000 new returns for this age bracket! South Carolina shares a similar story, with 53.6 percent of its nearly 25,000 new returns coming from this same bracket. These two states continued their strong performance from 2019. Clearly they are seen as highly desirable by America’s elder population: in the past 10 years of available data, both states have surpassed the national average for population 75 or older, with Florida remaining well above the national average. The data shows that these states continue to bring in those nearly or already retired, growing the economies of both states.
Meanwhile, the other top performing states appear to have a sort of youthful renaissance as of late; Texas, Arizona and North Carolina each gained at least 35,000 new taxpayers in the past year due to a large influx of younger taxpayers. Of Texas’ over 60,000 new returns, nearly 49 percent came from those under the age of 35. In Arizona and North Carolina, new returns from younger taxpayers amounted to 30 and 35.5 percent respectively. A fair amount of their growth was from elders as well; they appear to be desirable places to retire, similar to Florida and South Carolina.
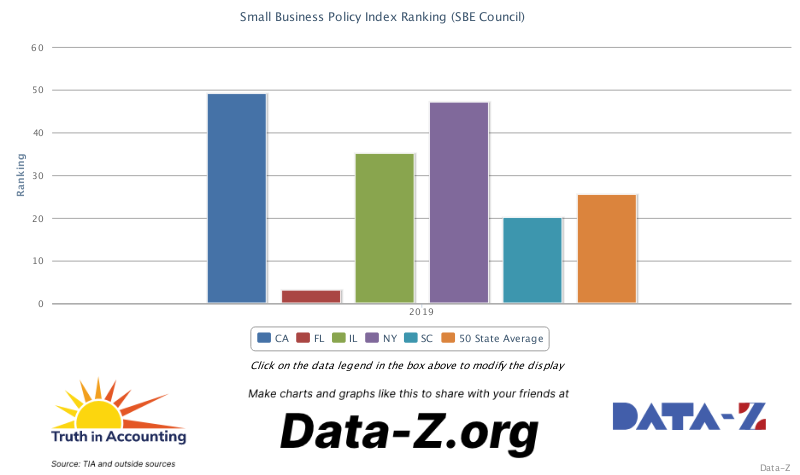
But why are segments of America’s population flocking to these states? There is always more than one factor, but one might be the business climate, as shown by the states’ overall performance in the SBE Council’s Small Business Policy Index (2019 data used as 2020 data not available). Of these five states, the top three performers all ranked within the top ten with Florida third, Texas second, and Arizona eighth. North and South Carolina came in at 15th and 20th, still respectable performances. When comparing their performance with the worst performers–New York, California, and Illinois–a stark difference can be seen.
Another index used to measure a state’s desirability for business is Chief Executive Magazine’s Best and Worst States for Business Survey, shows results similar to the SBE Council’s rankings.

The data show that states that perform better in business metrics appear to attract both America’s younger and older taxpayers, while those that perform poorly are losing their populace and income wealth in droves. The drive towards the American dream seems to be alive and well among the nation’s younger generation who may be escaping states with poor business climates and heading to these states in the hopes of building a better future for themselves and their families.
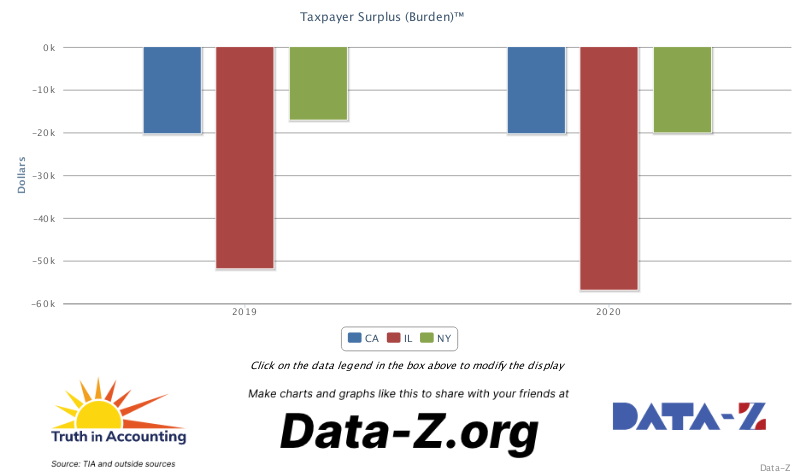
We’ve already seen how the bottom three states perform in terms of business metrics, but what else might be driving people away in such large numbers? In order to understand just how great the exodus from New York, California and Illinois has been, let’s take a look at some of the data. These three states alone lost nearly 300,000 individual tax returns; New York lost around 130,000, California lost 115,000 and Illinois lost 50,000. Perhaps bad government finances might help explain why taxpayers left these states. All three of these states are also in the bottom three in terms of debt and total Taxpayer Burden, which is the amount calculated by Truth in Accounting that each individual taxpayer would owe the state government to pay off its debt, with no services or benefits from this taxation.
Americans seem to be running away from high-tax states in favor of low-tax havens. Looking at income taxes generated by state compared to the number of taxpayers in the state, one can see the vast difference in average income tax collected per taxpayer with the migration patterns (2020 data used except for California where 2019 data is used since 2020 data is not available).
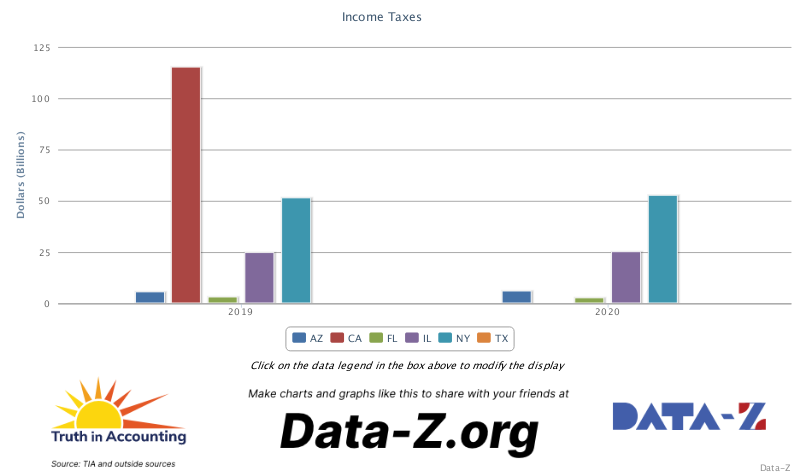
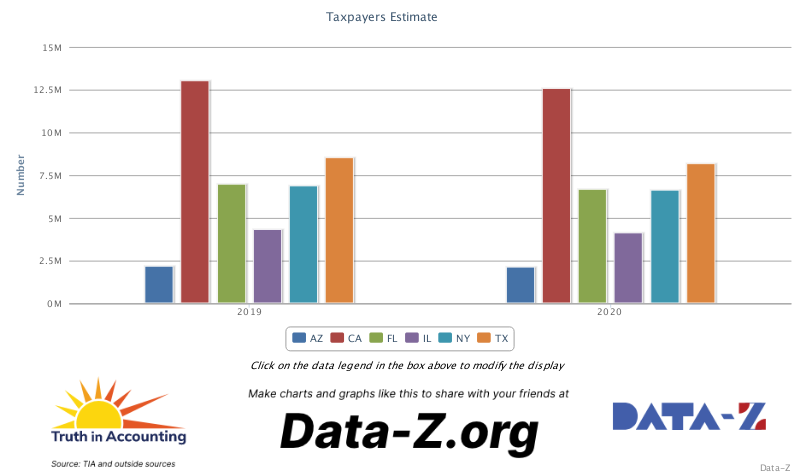
Each state in the bottom three takes in a minimum of $5,500 per taxpayer, calculated by taking a state’s total income tax revenue and dividing it by Truth In Accounting’s taxpayers estimate (The number of taxpayers in the state with a positive tax liability). California takes in over $8,800 per taxpayer, New York takes in over $7,900, and Illinois takes in just over $6,100. In contrast, no state in the top three performers takes in even $3,000; Arizona takes in around $2,750, Florida takes only a few hundred while Texas collects no state income tax at all!
Barring a change in policy to improve government finances, reduce taxes and improve business climate, it appears that there isn’t a way out of this hole for these three states. Despite these three states containing the largest cities in the country–New York City, Los Angeles, and Chicago respectively–wealth is pouring out of these states at an alarming rate, and into states such as Florida, Texas or the Carolinas. Time will tell whether these states continue to lose taxpayers and wealth and the beneficiaries of their out-migration of income continue to trend in the same direction as in prior years.
Data in this report comes from the IRS’ 2019-2020 Migration Data, available to the public at:
https://www.irs.gov/statistics/soi-tax-stats-migration-data-2019-2020
Data and graphs in this report can be generated by visiting Data-Z.org
Eric Piatek is a Data Research Intern at Truth In Accounting